Everglades Depth Estimation Network (EDEN) for Support of Biological and Ecological Assessments
EDEN Station Name: TSH
Location: Latitude 25°18'39", Longitude -80°37'50"
Subbasin Location: ENP
Average ground elevation (ft. NAVD88): -0.15
Vertical conversion at gage (ft.) used by EDEN (NGVD29 to NAVD88): -1.56
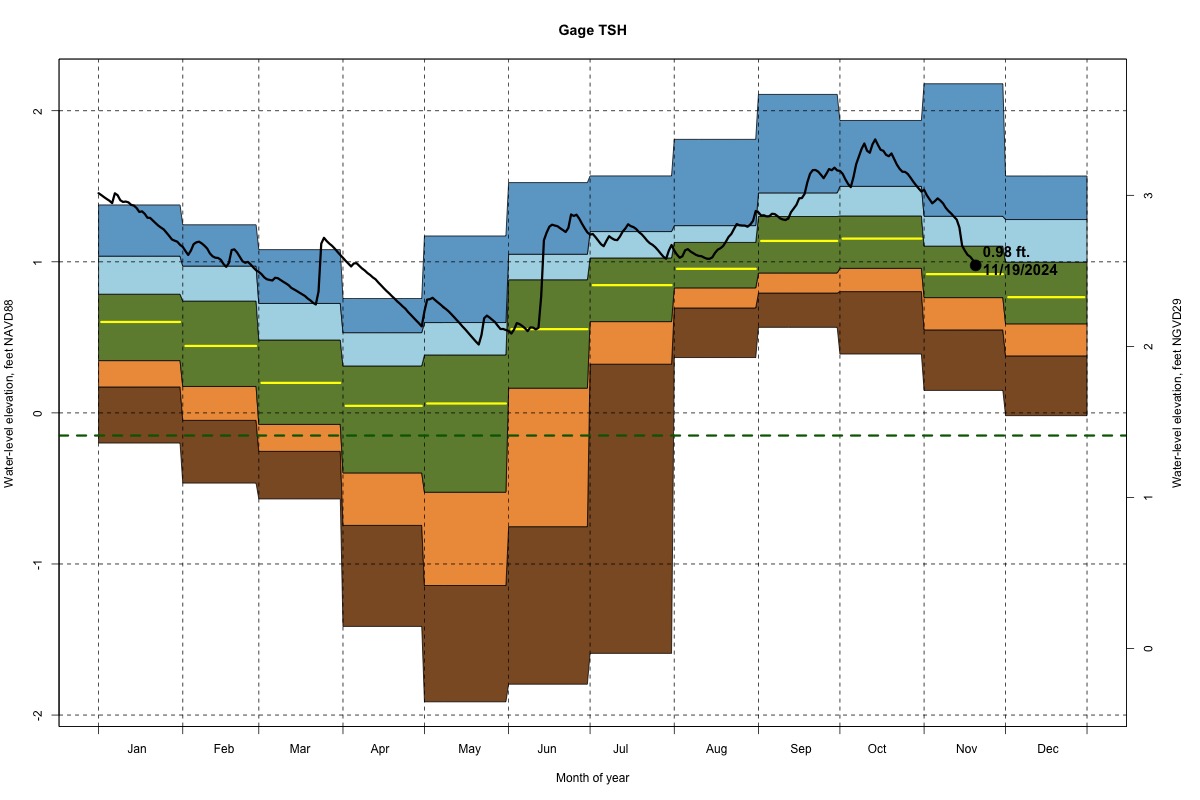
EDEN data are used to monitor water levels and to compare current water levels with water levels that occurred during the EDEN period of record (2000 through the previous year). The figure here shows recent daily median water levels at a given gage against water-level percentiles that are computed for each month (daily water levels that were not exceeded for a given percentage of the time) using water-level gage data from the period of record.
| Daily Water Level Percentiles by Month for TSH (percentiles based on 1/1/2000–2025) |
||
|---|---|---|
|
The recent daily water level for TSH on
--Recent daily water levels subject to revision-- |
||
| EXPLANATION | For more information: | |
| 90th Percentile to Maximum | ||
| 75th to 90th Percentile | ||
| 25th to 75th Percentile | ||
| 10th to 25th Percentile | ||
| Minimum to 10th Percentile | ||
| Median water level | ||
| Recent daily water level | ||
| Ground elevation at gage | ||
| Table of Daily Water Level Percentiles by Month for TSH (percentiles based on 1/1/2000–2025) |
|||||||
|---|---|---|---|---|---|---|---|
|
The recent daily water level for TSH on |
|||||||
| Minimum | |||||||
| 10th percentile | |||||||
| 25th percentile | |||||||
| Median | |||||||
| 75th percentile | |||||||
| 90th percentile | |||||||
| Maximum | |||||||
| January | -0.2 | 0.18 | 0.37 | 0.63 | 0.84 | 1.13 | 1.45 |
| February | -0.46 | -0.03 | 0.2 | 0.55 | 0.76 | 1.02 | 1.25 |
| March | -0.57 | -0.24 | -0.06 | 0.23 | 0.51 | 0.79 | 1.16 |
| April | -1.41 | -0.73 | -0.38 | 0.05 | 0.33 | 0.6 | 1.03 |
| May | -1.91 | -1.09 | -0.51 | 0.09 | 0.41 | 0.62 | 1.17 |
| June | -1.8 | -0.41 | 0.21 | 0.54 | 0.88 | 1.07 | 1.52 |
| July | -1.59 | 0.33 | 0.59 | 0.85 | 1.04 | 1.2 | 1.57 |
| August | 0.37 | 0.69 | 0.83 | 0.96 | 1.13 | 1.24 | 1.81 |
| September | 0.57 | 0.81 | 0.94 | 1.16 | 1.32 | 1.48 | 2.11 |
| October | 0.39 | 0.82 | 0.98 | 1.17 | 1.35 | 1.54 | 1.94 |
| November | 0.15 | 0.56 | 0.78 | 0.92 | 1.11 | 1.32 | 2.18 |
| December | -0.02 | 0.41 | 0.58 | 0.75 | 0.98 | 1.27 | 1.57 |
|
--Recent daily water levels subject to revision-- |
|||||||
The below figure shows the same daily median water levels from a given gage, but instead of comparing to gage water levels from the EDEN period of record, it compares the given gage to modeled water level values from the No Action 2022 (NA22f) hydrologic scenario (model period: 1965-2016). NA22f was developed from the South Florida Water Management District's Regional Simulation Model (RSM) and uses the ALTQ (Alternative Q) water operations schedule. Because NA22f is a modeled water surface, gage values were not available for comparison. The percentiles shown below are calculated from the model cell in which the gage is located.
| Daily Water Level Percentiles by Month for TSH (percentiles based on NA22F model 1965–2016) |
||
|---|---|---|
|
The recent daily water levels for TSH plotted against NA22F model results.
--Recent daily water levels subject to revision-- |