
Everglades Depth Estimation Network (EDEN) for Support of Biological and Ecological Assessments
In September of 2020, the EDEN project published a new version (Version 3, V3) of the EDEN Water Surface Model. This version replaces the last version (Version 2, V2) of the EDEN model.
Download the new (V3) EDEN Water Surface files or access the files through our EDEN THREDDS server.
Spatially continuous interpolations of water surfaces across the Greater Everglades are generated from daily median values of the water-level gages in the EDEN network beginning January 1, 1991. Surfaces are recorded as elevation in centimeters relative to North American Vertical Datum of 1988 (NAVD 88). More information on how water surfaces are created is available below.
The list of gages used to generate the daily water surface changes over time because gages are discontinued, new gages are constructed, or gages are added or removed from the EDEN network. The daily median output files provide users with the list of gages used for each day's water-level surface.
The EDEN surface-water model domain includes Water Conservation Areas 1, 2, and 3, the Pennsuco Wetlands, and the freshwater portions of Big Cypress National Preserve (BCNP) and Everglades National Park (ENP). Version 2 (V2) of the model added the northwest corner of ENP and southern portion of BCNP. Version 3 (V3) of the model retains the same footprint as V2.
The EDEN domain is gridded into 400 x 400 meter cells that in total are referred to as the "EDEN grid" and which allow for analysis of subsets of the grid and GIS analysis of other data layers over the EDEN domain, such as ground elevation data, rainfall data, and water depth computation. Learn more about the EDEN Grid.
Water stage and depth surfaces are available as NetCDFs (.nc), GeoTiffs (.tiff), and jpegs (.jpg). Surface input data are available via our Daily Median Files.
The EDEN surface-water model (V3) is fully documented in a USGS-series report published in September 2020. A summary of the revisions to the Version 2 (V2) model are listed below:
EDEN daily surfaces are identified by the quality of the input water-level data used to create the surface. Input data is either real-time, provisional, or final:
Water level surfaces from the V3 model were compared to an independently collected set of over 200 field data measurements at 69 elevation benchmark locations. The root mean square error (RMSE) of the difference between the interpolated and measured values was less than 5 centimeters, which indicates the ability of the model to estimate water levels extremely well in most areas of the Everglades. However, because there are fewer gages located in BCNP and in the western coastal areas of ENP, users should be more cautious when working with surfaces in these areas. A more detailed validation can be found in the V3 report.
The USGS retrieves water-level data daily from nearly 300 gaging stations. Most gages record and transmit several water-level values throughout the day, mostly hourly from recorders. A subset of these gages do not have telemetry and are manually read and added to the network when provisional and final data is produced. All transmitted data are entered and stored in the EDEN database. There are over 240 gages used for water surface interpolation of the freshwater Everglades.
All gages in the EDEN network are operated and maintained by four separate agencies including Everglades National Park (ENP), South Florida Water Management District (SFWMD), Big Cypress National Preserve (BCNP), and the USGS. Data is transferred via a local USGS FTP server to the EDEN database where it is available for surfacing.
The steps to create the daily water-level surfaces are summarized below and shown in Figure 1:
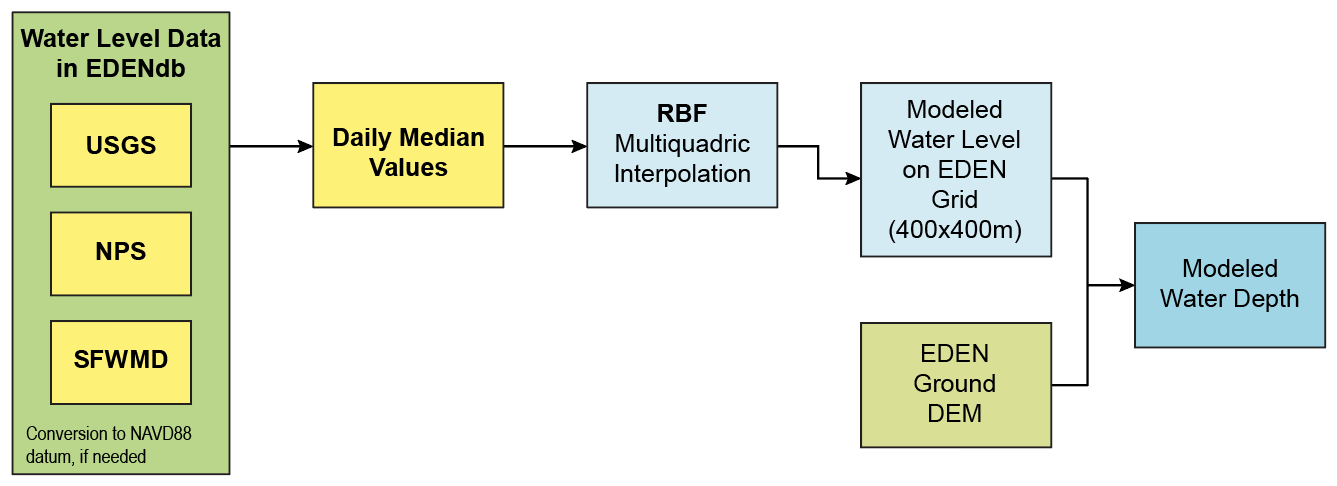
Figure 1: Water level data from USGS, NPS, and SFWMD are collated into the EDEN Database (EDENdb), daily median values are entered into Radial Basis Functions (RBF) to generate modeled water level surfaces; when combined with the EDEN Digital Elevation Model (DEM), modeled water depth surfaces are produced.