(updated July 10, 2012)
 |
|
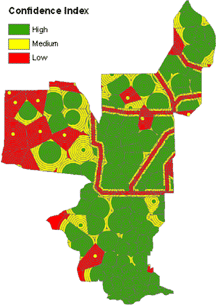
Confidence index computed by Pearlstine then binned into low (CI < or = 0.39), medium (CI > 0.39 and < or = 0.69), and high (CI > 0.69) (from Pearlstine, 2007). [larger image] |
In 2007, Pearlstine and others (2007) developed a confidence index (CI) for the V1 surface-water model to give a general indication of confidence in the accuracy of the EDEN-modeled water levels. The CI for a grid cell is the geometric mean of three parameters weighted by level of significance:
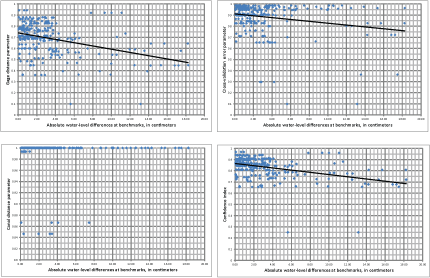
This index was tested using the newest version (V2) of the EDEN surface-water model and water-level measurements at a network of 72 benchmarks. Differences for 300 measurements were computed between the measured water levels at these benchmarks and the modeled water levels using the V2 model. The absolute values of these differences were plotted against the gage distance parameter, canal distance parameter, CVE parameter and the CI to test the correlations.
 |
|
Plots of gage distance parameter, canal distance parameter, model cross-validation error parameter, and confidence index by Pearlstine et al. versus the absolute differences between the modeled water level using the EDEN water-surface model and the measured water levels at the benchmarks between 2007 and 2011. [larger image] |
Plots of the gage distance parameter, canal distance parameter, and CVE parameter show that none of these parameters are strongly correlated with the water-level differences at the benchmarks. Likewise, the differences do not correlate with the CI.
 |
|
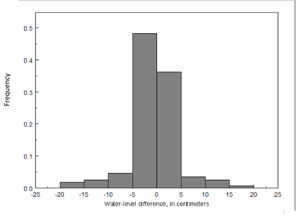
Plots of water-level distance versus frequency. [larger image] |
Over 82 percent of differences at the benchmarks are plus or minus 5 centimeters, which indicates the ability of the model to estimate the daily water-level surface extremely well in most areas of the Everglades.
Although a CI map would provide users with a general guideline about the accuracy of water levels modeled by EDEN, the parameters that define the areas with lower confidence are not yet clear. See the USGS-series report documenting the EDEN V2 surface-water model due later this year for more details about the accuracy of the EDEN water-level surfaces.
Pearlstine, L., Higer, A., Palaseanu, M., Fujisaki, I., and Mazzotti, F., 2007, Spatially continuous interpolation of water stage and water depths using the Everglades Depth Estimation Network (EDEN): Gainesville, FL. Institute of Food and Agriculture, University of Florida, CIR 1521, 18 p., 2 apps.
