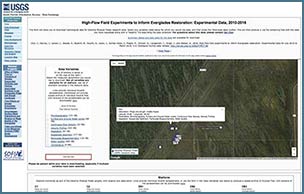
High-Flow Field Experiments to Inform Everglades Restoration: Experimental Data, 2010-2016
Summary Tables and Graphs
|
A. Microtopography
Table A-1: Mean and Variability of Peat Elevations in Decompartmentalization Physical Model (DPM), 2010 and 2011.
Table A-2: Mean and Variability of Floc Thickness in DPM, 2010 and 2011.
Figures: A-1 - A-42. (examples of some of the plots available are below)
 Figure A-1. Site C1 distribution of peat surface elevation and vegetation type contrasted with water level exceedance probability at EDEN site 69E. |
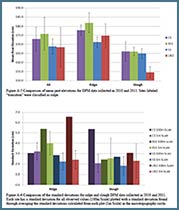
 Figure A-5. Comparison of mean peat elevations for DPM data collected in 2010 and 2011. |
 Figure A-8. Time series graph of averaged microtopography elevations collected near the KPSI piezometer at site C2 slough. |
B. Surface Water and Groundwater Levels
Figures: B-1 - B-55. (examples of some of the plots available are below)
 Figure B-1. Time series plot of water level elevation at all of the sites in DPM. |
 Figure B-17. Time series plot of water levels at C1 in DPM for the period of the 2013 flow release. |
 Figure B-14. Time series plot of surface water and groundwater in DPM at site Z51_USGS. |
C. Surface Flow Velocities and Shear Stress
Table C-1: Monthly Flow Velocity Statistics for continuously sampled Acoustic Doppler Velocimeter (ADV) sites.
Figures: C-1 - C-177. (examples of some of the plots available are below)
 Figure C-1. Daily average ADV flow vectors recorded at continuously sampled DPM sites during water years 2010 through 2015. |
 Figure C-103. ADV velocity profiles recorded at DPM site C1 Slough. |
 Figure C-5. Time series plot of continuously sampled burst average ADV flow direction recorded at C2S site during water year 2015 (8/1/2015 � 3/31/2016). |
 Figure C-151. Velocities at Z51 Slough from Flow Tracker measurements. |
D. Suspended Particle Sizes and Concentration
Table D-1: SSC calculated error.
Table D-2: Error analysis performed using duplicate samples taken March 9-10, 2015.
Table D-3: Error analysis performed using duplicate samples taken March 1-3, 2016.
Figures: D-1 - D-365. (examples of some of the plots available are below)
 Figure D-1. Time series plot of suspended sediment concentration at site RS1U during the November 5th, 2013 flow release. |
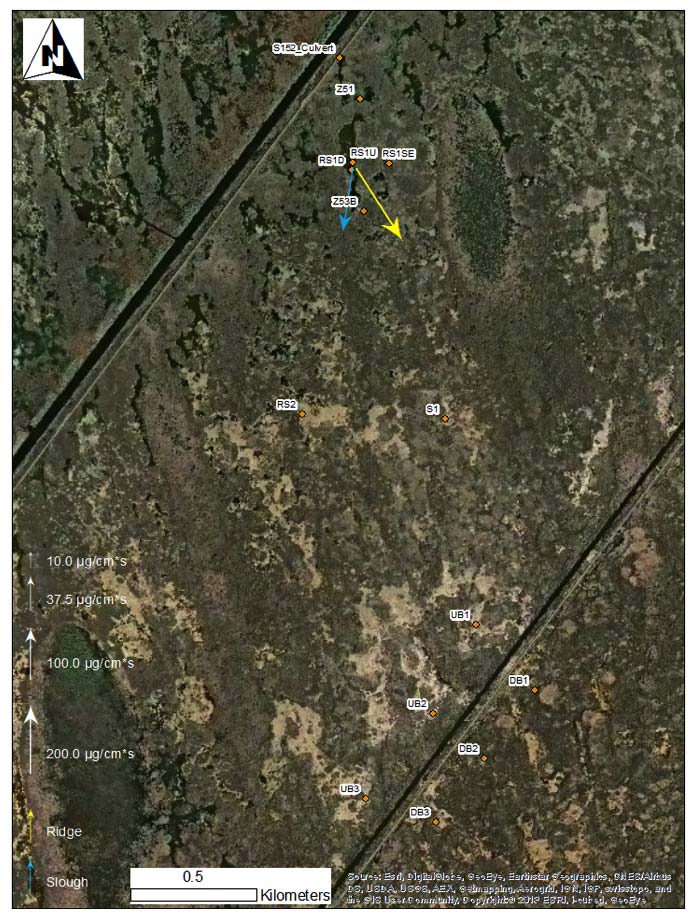 Figure D-122. Transient Flow 1 Suspended Sediment Load. |
 Figure D-23. Time series plot of phosphorus concentration near the bed (5 cm) at all sites during the November 5th, 2013 flow release. |
 Figure D-210. Stacked time series plot of particle size distribution and volume-weighted particle size distributions at RS1D Ridge site. |
E. Biogeochemical Sampling
Figures: E-1 - E-208. (examples of some of the plots available are below)
 Figure E-1. Volume weighted distributions of suspended particles for water column samples collected November 2-3, 2013. |
 Figure E-8. Comparisons of volumetric fraction distributions of Water Column, Floc and Epiphyton by size for samples collected November 2-3, 2013. |
 Figure E-7. Comparison of average volume weighted equivalent diameter for each particle type of samples collected November 2-3, 2013. |
 Figure E-115. Labile, microbial and refractory fractionation and total phosphorus concentrations from floc, epiphyton and water column samples collected at C1 from 2010 through 2012. |
F. Vegetation Influence on Flow
Table F-1: The dominant species contributing to each vegetative community.
Table F-2: Vegetative data refer to stems and leaves greater than 15 cm in length with epiphyton collected in September and November of 2010.
Table F-3: Vegetative data refer to stems and leaves greater than 15 cm in length after removal of epiphyton collected in September and November of 2010.
Table F-4: Vegetative data refer to only stems and leaves greater than 15 cm in length collected in November 2011.
Table F-5: Vegetative data refer to only stems and leaves greater than 15 cm in length collected in November 2012.
Table F-6: Vegetative data refer to only stems and leaves greater than 15 cm in length collected in August 2013.
Table F-7: Vegetative data refer to only stems and leaves greater than 15 cm in length collected in August 2014.
Figures: F-1 - F-21. (example of some of the plots available are below)
 Figure F-1. Average vegetation stem diameter, frontal area, and dimensional volume (fraction of bulk volume) at site L67A Ridge. |
G. Water Quality Monitoring
Figures: G-1 G-13. (example of some of the plots available are below)
 Figure G-1. Time Series plot of turbidity for all sites during the flow release, November 4-10, 2013. |
H. Groundwater � Surface Water Interactions Detected using Heat as a Tracer
Figures: H-1 - H-8. (examples of some of the plots available are below)
 Figure H-1. Temperature data from RS1D collected between September, 2013 and November, 2014 at various depths at and below the peat-floc boundary. |
 Figure H-6. Temperature data from Z51_USGS collected between August, 2014 and February, 2016. |
Download methodology and data plots (.pdf, 34 MB)
If you cannot fully access the information in this document, please contact Heather S. Henkel at [email protected].